What Is a Negatively Skewed Distribution?
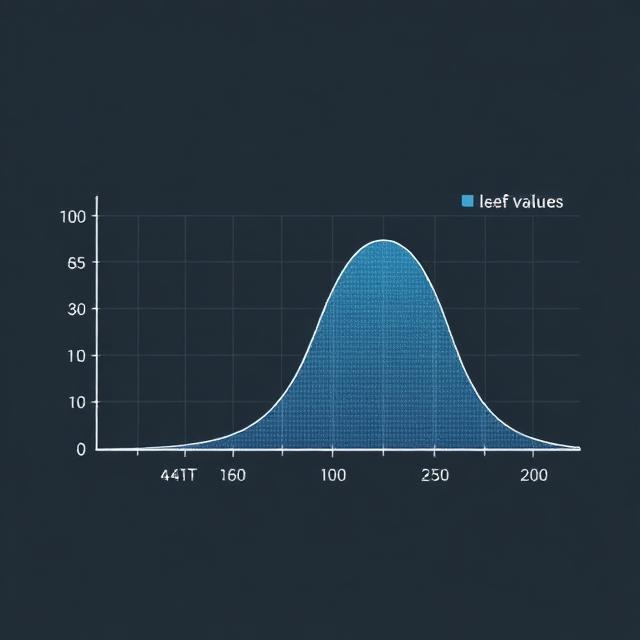
A negatively skewed distribution—also called a left-skewed distribution—is a distribution where the tail on the left side is longer or fatter than the tail on the right side. This means that a smaller number of extreme negative values drag the mean downward.
In a negatively skewed dataset:
- The mean < median < mode
- Most values cluster on the right side
- The left tail contains rare but large negative outliers
This shape signals that while most outcomes are relatively high, the occasional negative outlier can significantly affect the average.
Negative Skew vs. Positive Skew
| Feature | Negatively Skewed Distribution | Positively Skewed Distribution |
|---|---|---|
| Tail direction | Left | Right |
| Mean relationship | Mean < Median | Mean > Median |
| Common outcomes | Many high values | Many low values |
| Outliers | Rare negative extreme events | Rare positive extreme events |
| Risk implication | Sudden large losses | Sudden large gains |
A normal distribution, by contrast, shows symmetry and has zero skewness.
What Causes Negative Skewness?
Negative skewness arises when:
- Most observations fall within a high-value range
- A few extreme outcomes fall much lower than the rest
- Real-world constraints limit upward variation but allow downward shocks
Examples include:
- Minimum-bound variables (e.g., no one can live fewer than 0 years)
- Economic downturns that generate rare but large negative shocks
- Trading strategies with many small gains and occasional huge losses
Why Negative Skewness Matters in Statistics
Skewness reveals the building blocks of probability—not just the average, but how the extremes behave. A negatively skewed distribution:
- Shows where outliers occur
While it does not show how many, it clearly indicates that extreme values are on the left. - Improves understanding beyond averages
Relying on mean alone is misleading because extreme negatives pull the mean lower. - Identifies tail risk
Where the most damage or uncertainty exists.
How Negative Skewness Is Measured
Two common methods are Pearson’s coefficients, which compare mean, median, and mode against the standard deviation.
Pearson’s First Coefficient (Mode Skewness)
Sk1=Xˉ−MosSk_1 = \frac{\bar{X} – Mo}{s}Sk1=sXˉ−Mo
Pearson’s Second Coefficient (Median Skewness)
Sk2=3(Xˉ−Md)sSk_2 = \frac{3(\bar{X} – Md)}{s}Sk2=s3(Xˉ−Md)
Where:
- Xˉ\bar{X}Xˉ = mean
- MoMoMo = mode
- MdMdMd = median
- sss = standard deviation
Positive results indicate right skew; negative values indicate left skew.
Negatively Skewed Distribution in Finance and Investing
In financial analysis, negative skewness is especially important because:
- Returns are not normally distributed
- Extreme negative tail events can cause disproportionate damage
- Standard deviation alone ignores asymmetry
This is why relying only on volatility can underestimate risk.
Skewness Risk
Skewness risk is the risk of encountering a value deep in the skewed tail. For negatively skewed distributions, this means:
- Frequent small profits
- Rare but massive losses
- Simulation or backtesting may mask true risk
This is a major concern for traders using models built on normal distributions.
Negative Skewness in Trading Strategies
In trading, a negatively skewed distribution usually signals a dangerous profit pattern:
“Many small wins, one big loss.”
Trading strategies with negative skew:
- Mean-reversion strategies
- Pairs trading (especially with Martingale-style size increases)
- Some statistical arbitrage setups
- Merger/arbitrage strategies with asymmetric payout profiles
These strategies often feel smooth and safe—until they catastrophically fail.
Example
A mean-reversion strategy may show:
- 80–90% winning trades
- Small repeated gains
- Rare but extreme losses when the market does not revert
These infrequent large losses can wipe out years of profit.
Negatively Skewed Distribution Example (Statistics)
A classic real-world example is income distribution.
In many countries, most households earn moderate to high income levels, but rare cases of extremely low incomes pull the mean down—creating a left-skewed pattern.
Other examples include:
- Human lifespan (few die young; most die older)
- Test scores on very easy tests
- Customer complaints frequency
Is Negative Skewness Good or Bad?
It depends on context.
✔ Good When:
- You need predictable, frequent positive outcomes
- The downside is controlled or insured
- The distribution is intentional (e.g., certain risk-managed options strategies)
✘ Bad When:
- You underestimate tail risk
- You ignore rare catastrophic loss events
- You use models assuming normal distribution
- You depend on strategies with high win rate but fat left tail
In trading, negative skewness is generally dangerous, especially for new traders.
How to Manage Negative Skewness Risk
- Use strict stop-loss rules, even in mean-reversion systems
- Avoid adding to losing trades unless strategically structured
- Perform stress tests for low-probability outlier scenarios
- Analyze the entire distribution, not just win rate or average return
- Limit position size to reduce exposure to tail events
Risk management is essential because rare extreme events can erase long periods of success.
Negative Skew vs. Positive Skew in Trading
| Distribution Type | Win Rate | Profit Pattern | Risk |
|---|---|---|---|
| Negative skew | High win rate | Many small wins, rare big losses | Blow-up risk |
| Positive skew | Low win rate | Many small losses, rare huge wins | Can yield long-term upside |
| Normal distribution | Balanced | Symmetric outcomes | Least likely in real markets |
Trend-following strategies, for example, tend to have positive skewness because a few big winners offset many small losses.
Negative Skew in the Economy and Markets
The stock market often displays negative skewness in short-term returns:
- Many mild positive days
- A few extreme crashes (e.g., 1987, 2008, 2020)
Individual stocks, however, may vary—some even show right skew due to explosive winning outliers.
Economic variables with negative skew include:
- Household income
- Productivity shocks
- Certain consumer behavior patterns
Bottom Line
A negatively skewed distribution reveals an asymmetry where rare but severe negative outcomes significantly impact the mean. In statistics, it helps analysts understand where outliers lie. In trading and finance, it exposes hidden risks—especially strategies that appear safe but can collapse unexpectedly.