What Is the Morning Star Candlestick Pattern?
The Morning Star pattern is one of the most reliable candlestick formations used by traders to spot bullish reversals. It signals a shift from selling dominance to buying momentum, indicating a potential upward trend.
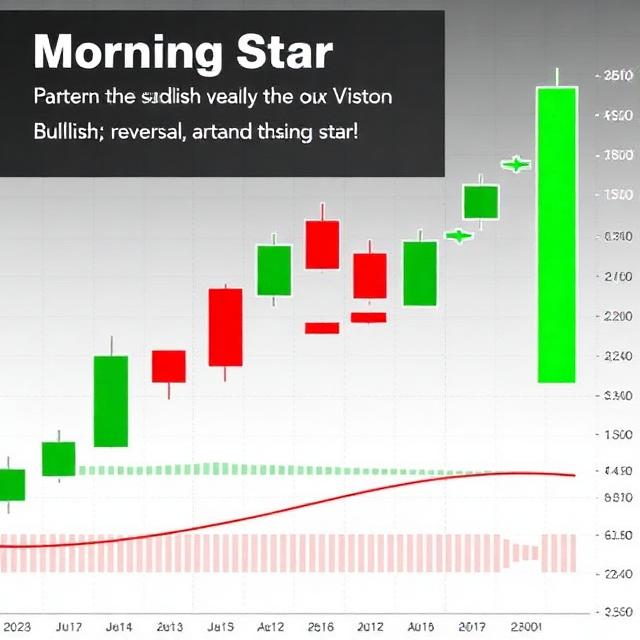
This pattern consists of three candles:
- First Candle: A long bearish candle representing strong selling pressure.
- Second Candle: A small-bodied candle (bullish or bearish) showing indecision or market pause. It often gaps down from the first candle.
- Third Candle: A long bullish candle that closes above the midpoint of the first candle, signaling buyers are taking control.
Traders watch this formation closely, as it often appears after extended downtrends in stocks, forex, crypto, or indices.
How to Identify a Morning Star Pattern
Identifying the Morning Star requires attention to trend, candle formation, and confirmation tools:
- Spot the Downtrend: Ensure the market has been in a sustained decline. Morning Star patterns are most meaningful after a strong downtrend.
- Analyze the Candles:
- Candle 1: Long bearish candle showing selling dominance.
- Candle 2: Small-bodied indecision candle, often gapped down.
- Candle 3: Long bullish candle that closes above the midpoint of Candle 1.
- Confirm with Indicators: Use additional tools for reliability:
- RSI (Relative Strength Index): Check if the asset is oversold (<30).
- Moving Averages: Spot the pattern near 50-day or 200-day MA for trend confirmation.
- Fibonacci Retracement: Look for reversals at key levels (38.2%, 50%, 61.8%).
- Support/Resistance Levels: Ensure the pattern forms near strong historical support.
Step-by-Step Guide to Trading the Morning Star
Trading this pattern effectively involves patience and structured execution:
- Wait for Completion: Let all three candles form. Avoid guessing mid-pattern.
- Entry Point: Buy after the third bullish candle closes above the midpoint of the first bearish candle.
- Stop-Loss Placement: Place just below the low of the middle candle to limit risk.
- Take-Profit Target: Use historical resistance, Fibonacci extensions, or moving averages to set realistic profit points.
- Monitor the Trade: Watch price movement and be ready to adjust stops or take partial profits if momentum stalls.
Common Mistakes When Trading the Morning Star
Even a clear pattern can fail if traders overlook essential factors:
- Entering Too Early: Wait for the third candle to fully close.
- Ignoring Market Context: Check news, trend, and overall market structure.
- Skipping Confirmation: Don’t rely solely on the pattern—use volume, RSI, or MA for validation.
- Poor Risk Management: Always define stop-loss and take-profit levels.
- Trading in Low-Volume Assets: Low liquidity can produce false signals.
Advanced Strategies to Boost Accuracy
Enhance the reliability of the Morning Star pattern with these techniques:
1. Support and Resistance Integration
Identify key support levels and trade only when the pattern forms near them. This increases the probability of a genuine reversal.
2. Trendline Confluence
Draw trendlines connecting recent highs or lows. A Morning Star at the bottom of a trendline indicates a shift from bearish to bullish momentum.
3. Fibonacci Retracement
Use retracement levels (38.2%, 50%, 61.8%) to pinpoint potential reversal zones. Enter trades only when the pattern aligns with these levels.
4. RSI Confirmation
Combine the pattern with RSI readings. A value below 30 at the time of pattern formation strengthens the bullish signal.
5. Moving Average Validation
Adding a 50-day or 200-day moving average can confirm trend shifts. Patterns forming near these averages often indicate stronger reversals.
6. Volume Analysis
High volume on the first and third candles and low volume on the middle candle confirms strong momentum shifts.
7. Timeframe Consideration
Patterns on higher timeframes (H4, D1) are more reliable than those on lower timeframes (M5, M15).
Morning Star vs. Evening Star
While the Morning Star signals bullish reversals, the Evening Star is its bearish counterpart:
| Pattern | Trend | Signal |
|---|---|---|
| Morning Star | Downtrend | Bullish reversal |
| Evening Star | Uptrend | Bearish reversal |
Understanding the difference helps traders anticipate price movements and adjust strategies accordingly.
Real-World Trading Example
Imagine EUR/USD in a prolonged downtrend:
- Candle 1: EUR/USD closes sharply lower, showing strong selling.
- Candle 2: A small-bodied doji forms below the first candle.
- Candle 3: Price surges, closing above the midpoint of Candle 1.
Confirmation with RSI (<30) and support at 1.1000 strengthens the trade setup. Enter long with a stop-loss below the doji and take profit near the next resistance level.
Risk Management Tips
- Never risk more than 1–2% of your capital on a single trade.
- Adjust position size according to stop-loss distance.
- Consider partial profit-taking at key resistance zones.
- Use trailing stops once the trade moves in your favor to lock profits.
FAQs About Morning Star Candlestick Pattern
Q1: Can Morning Star appear in all markets?
Yes, it works in Forex, stocks, crypto, and indices.
Q2: Is it reliable on lower timeframes?
Less reliable due to noise; better on H1, H4, or D1.
Q3: How does it differ from bullish engulfing?
A bullish engulfing is two candles, while Morning Star is three with a middle indecision candle.
Q4: Should I trade without confirmation?
No. Always combine with trend, support/resistance, or indicators.
Conclusion
The Morning Star candlestick pattern is a cornerstone for traders seeking bullish reversal opportunities. Recognizing it, confirming it with technical tools, and applying disciplined risk management can enhance your trading outcomes significantly.