Introduction: What Are Trading Patterns?
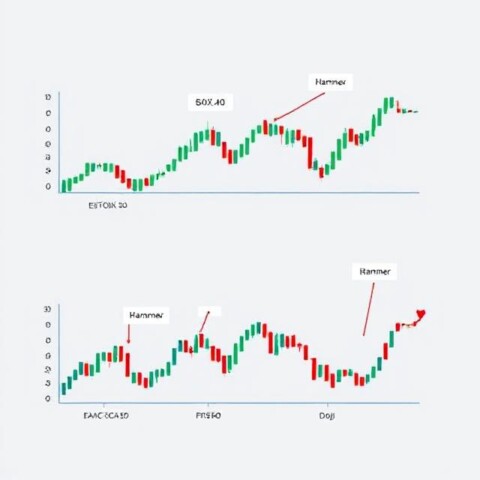
Trading patterns, also known as chart patterns, are visual formations on price charts that indicate potential market behavior. Traders across stocks, forex, commodities, and crypto use these patterns to anticipate trend continuation, reversals, or market indecision.
Patterns are not guarantees but probabilistic guides informed by historical price action and trader psychology. By mastering them, traders can improve entries, exits, and risk management strategies.
Why Trading Patterns Matter
Trading patterns are fundamental in technical analysis because:
- They summarize price history visually.
- Help forecast future price action.
- Reflect collective market psychology.
- Provide actionable trading signals when combined with volume, support/resistance, and other indicators.
Types of Trading Patterns
Trading patterns generally fall into four main categories:
- Reversal Patterns – Indicate a potential change in trend direction.
- Continuation Patterns – Signal the current trend is likely to persist.
- Bilateral Patterns – Market could break in either direction.
- Complex Patterns – Multi-phase or cyclical patterns often requiring advanced analysis.
Reversal Patterns
Reversal patterns suggest that the prevailing trend is losing momentum and a change in direction is likely.
1. Double Top
- Formation: Two peaks at similar price levels forming an “M.”
- Signal: Bearish reversal.
- Confirmation: Price breaks below the trough between peaks.
- Tip: Volume should increase during the breakout for reliability.
2. Double Bottom
- Formation: Two lows at similar levels forming a “W.”
- Signal: Bullish reversal.
- Confirmation: Price breaks above the peak between lows.
3. Head and Shoulders
- Formation: Three peaks – left shoulder, head (highest), right shoulder.
- Signal: Bearish reversal.
- Confirmation: Break below neckline with volume surge.
- Trader Insight: The closer the shoulder formation, the stronger the signal.
4. Inverse Head and Shoulders
- Formation: Three troughs – left, lowest head, right.
- Signal: Bullish reversal.
- Confirmation: Break above the neckline.
5. Triple Top & Triple Bottom
- Formation: Three peaks or troughs at similar levels.
- Signal: Trend reversal.
- Confirmation: Break of support or resistance.
6. Rounding Top & Bottom
- Formation: Gradual “U” or inverted “U.”
- Signal: Long-term trend reversal.
- Confirmation: Breakout above/below resistance/support.
7. Quasimodo
- Formation: Higher highs and lower lows creating a reversal signal.
- Tip: Often signals strong trend reversals when combined with support/resistance.
8. Dead Cat Bounce
- Formation: Temporary recovery during a downtrend.
- Signal: Continuation of the bearish trend.
9. Island Reversal
- Formation: Price gaps isolate a group of bars.
- Signal: Strong reversal; rare but powerful indicator.
Continuation Patterns
Continuation patterns indicate the trend will likely resume after a pause or consolidation.
1. Triangles
- Symmetrical Triangle: Converging trendlines, breakout may go either direction.
- Ascending Triangle: Flat top, rising bottom – bullish continuation.
- Descending Triangle: Flat bottom, falling top – bearish continuation.
2. Wedges
- Rising Wedge: Typically bearish reversal; trend slows upward before falling.
- Falling Wedge: Typically bullish reversal; trend slows downward before rising.
3. Flags & Pennants
- Flags: Rectangular shape, slopes opposite to trend; continuation after breakout.
- Pennants: Small triangles after sharp price movement; breakout confirms trend.
4. Price Channels
- Parallel trendlines; breakout signals continuation or trend change.
- Channels can be bullish, bearish, or horizontal.
5. Cup and Handle
- Rounded bottom (cup) followed by slight pullback (handle); breakout indicates continuation.
Bilateral Patterns
Bilateral patterns signal uncertainty, where the price could break up or down.
- Symmetrical Triangle (see above)
- Broadening Wedge / Expanding Triangle: Diverging trendlines; breakout direction determines trend.
Complex Patterns
Complex patterns require advanced understanding and often involve mathematical or cyclical elements.
- Harmonic Patterns: Include Bat, Gartley, Butterfly; rely on Fibonacci ratios for precise reversals.
- Elliott Waves: Five-wave impulsive, three-wave corrective structure; forecast market cycles.
- Three Drives: Harmonic reversal with three price swings at Fibonacci levels.
- Wolfe Waves: Five-wave pattern predicting reversal points and target prices.
Actionable Trading Tips
- Confirm Patterns: Always wait for breakouts and volume validation.
- Combine Indicators: Use RSI, MACD, or moving averages to improve accuracy.
- Plan Risk Management: Set stop-loss and target levels per pattern reliability.
- Observe Market Sentiment: Patterns reflect collective trader psychology.
- Practice in Demo Accounts: Refine recognition and trade execution safely.
Understanding Trader Psychology
Trading patterns reflect human behavior:
- Peaks & troughs = fear and greed cycles.
- Consolidation patterns = indecision or equilibrium between buyers and sellers.
- Breakouts = strong conviction and momentum.
Mastering patterns means understanding both price action and underlying market sentiment.
Integrating Trading Patterns With Strategy
- Use patterns as guides, not guarantees.
- Combine with trendlines, support/resistance, and volume for higher-probability setups.
- Patterns work across multiple timeframes; analyze intraday for short-term trades, daily/weekly for longer-term strategies.
Conclusion
Trading patterns are the backbone of technical analysis. From simple double tops to complex harmonic formations, each pattern offers unique insights into market behavior. By mastering these patterns, confirming signals with volume and technical indicators, and applying strict risk management, traders can make more informed, confident decisions.