What Is OBV (On-Balance Volume)?
OBV—short for On-Balance Volume—is a technical analysis indicator created by Joseph Granville in 1963. It measures momentum by comparing price direction with volume flow. Granville believed volume is the true force behind market movement and that volume often shifts before price does.
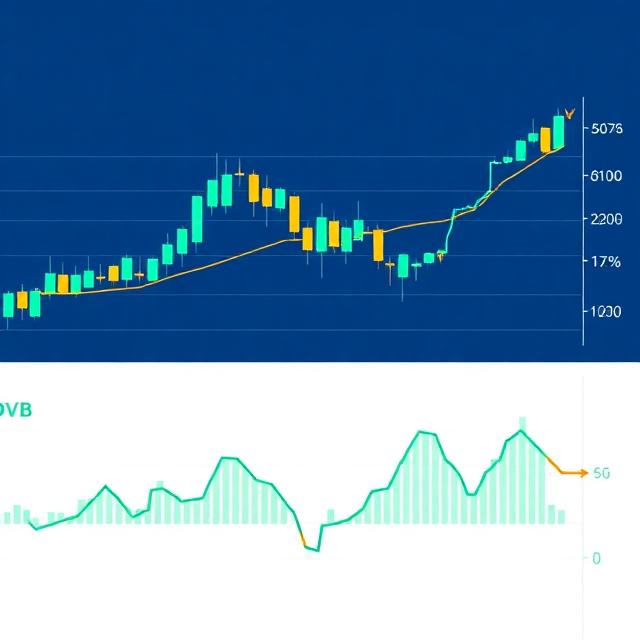
In practical terms, OBV acts as a real-time map of buying and selling pressure. When price moves up on high volume, OBV rises. When price drops on heavy volume, OBV falls. When price is flat but OBV moves strongly, traders interpret this as a clue that smart money may be positioning ahead of a major price move.
How OBV Works
The core principle is simple:
- Price up → add volume to OBV
- Price down → subtract volume from OBV
- Price unchanged → OBV stays the same
Because OBV is cumulative, it focuses on direction, not numerical value. Traders care about whether OBV is rising, falling, or diverging—not the specific number.
The OBV Formula
OBV is calculated using three possible conditions:
1. Price closes higher than previous close
OBV = Previous OBV + Current Volume
2. Price closes lower than previous close
OBV = Previous OBV – Current Volume
3. Price closes unchanged
OBV = Previous OBV
Since the indicator is cumulative, the starting value is arbitrary. What matters is the slope and direction of the line over time.
Why OBV Matters: Core Insights
OBV is popular because of what it reveals about market psychology:
1. Identifying Smart Money Activity
Institutional investors often accumulate positions quietly before a large price move. OBV may rise even when price appears stagnant—hinting that large buyers are stepping in.
2. Anticipating Trend Shifts
When OBV moves decisively before price does, it can warn of reversal or confirmation:
- Rising OBV + flat price → likely bullish breakout
- Falling OBV + flat price → likely bearish breakdown
3. Filtering Price Noise
OBV helps distinguish real moves from fakeouts. A price breakout supported by rising OBV is typically more reliable.
How to Use OBV in Trading
1. Trend Confirmation
The simplest use of OBV is confirming whether the current trend is supported by volume.
Bullish confirmation
- Price is making higher highs
- OBV is also making higher highs
Bearish confirmation
- Price is making lower lows
- OBV is also making lower lows
When price trends without OBV support, caution is warranted.
2. Detecting Divergence
Divergence occurs when OBV moves in the opposite direction of price.
Bullish Divergence
- Price makes lower lows
- OBV makes higher lows
This suggests selling pressure is weakening—even if the chart doesn’t show it yet.
Bearish Divergence
- Price makes higher highs
- OBV makes lower highs
This indicates buying volume is fading, often before the trend reverses.
3. Predicting Breakouts
Granville famously compared OBV pressure to a coiled spring.
Examples:
- OBV rises sharply while price is flat → buyers building pressure → likely upside breakout
- OBV drops sharply while price is flat → sellers gaining control → likely downside move
OBV frequently turns weeks or days before the actual breakout.
4. Identifying Accumulation vs. Distribution
- Accumulation: OBV rising (institutions buying)
- Distribution: OBV falling (institutions selling)
Many traders look for these clues around:
- Support/resistance levels
- Ranging markets
- Earnings events
- News catalysts
Practical Example: OBV Calculation Over 10 Days
Consider a stock with the following closing prices and volumes:
- Up days add volume
- Down days subtract volume
- Flat days keep OBV unchanged
Following this rule set, OBV creates a cumulative running total that reflects buying or selling pressure regardless of short-term price moves. Traders use this cumulative pattern to evaluate momentum and potential trend changes.
OBV vs. Other Volume Indicators
OBV vs. Accumulation/Distribution Line
Both measure volume pressure, but they differ fundamentally:
| Indicator | Focus | Method |
|---|---|---|
| OBV | Direction of volume | Adds or subtracts full volume based on price up/down |
| A/D Line | Position of close within range | Uses the money flow multiplier × volume |
The A/D line provides more nuance about intraday price position, while OBV provides clearer directional momentum signals.
OBV vs. Volume Price Trend (VPT)
VPT is more complex:
- OBV considers only whether price moved up or down
- VPT considers how much price moved, multiplying volume by the percentage change
VPT produces more sensitivity, while OBV offers clearer swings.
Limitations of OBV
Although OBV is powerful, it has weaknesses:
1. Prone to False Signals
As a leading indicator, OBV sometimes moves without price follow-through. Divergences can persist for long periods.
2. One-Day Volume Spikes Can Distort the Indicator
Events such as:
- Earnings announcements
- Index inclusion/exclusion
- Institutional block trades
…can create OBV jumps that don’t truly reflect trend strength.
3. Works Best When Combined With Other Indicators
Common pairings:
- Moving averages
- RSI
- Support/resistance
- MACD
Is OBV a Leading or Lagging Indicator?
OBV is a leading indicator because it attempts to predict future price movement based on volume flow. Leading indicators provide early signals but sometimes produce misleading hints when price fails to confirm the move.
For reliable results, OBV should be paired with lagging indicators that validate the trend.
The Bottom Line
OBV (On-Balance Volume) is a foundational momentum indicator that helps traders understand real buying and selling pressure behind price movement. While easy to calculate and widely available, its real value comes from analyzing the slope, trend, and divergences in the OBV line—not the numerical values.